![SDL - 2025 New Logo.png]](https://help.getsdl.com/hs-fs/hubfs/SDL%20-%202025%20New%20Logo.png?height=40&name=SDL%20-%202025%20New%20Logo.png)
1. This is a basic guide to sorting and filtering your data grid.-png.png?width=670&height=503&name=1_800x600_z-undefined_mz-0-5_mi-1_ti-0_ar-1_cr-0_si-0_fr-0_tb-1_t-_ftc-_ftb-_mc-_mfc-_complete%20(6)-png.png)
2. A simple way to sort your data grid is by column heading.-png.png?width=670&height=503&name=2_800x600_z-undefined_mz-0-5_mi-1_ti-0_ar-1_cr-0_si-0_fr-0_tb-1_t-_ftc-_ftb-_mc-_mfc-_complete%20(6)-png.png)
3. First decide the date range of the records you want displayed in your data grid. Click on the calendar to set the date parameters.
-png.png?width=670&height=503&name=3_800x600_z-undefined_mz-0-5_mi-1_ti-0_ar-1_cr-0_si-0_fr-0_tb-1_t-_ftc-_ftb-_mc-_mfc-_complete%20(6)-png.png)
4. Review the notice highlighted in yellow. It will tell you the current filter that's being displayed as well as the field it is using as criteria. This filter is looking at the application date field and is displaying all dates.
-png.png?width=670&height=503&name=4_800x600_z-undefined_mz-0-5_mi-1_ti-0_ar-1_cr-0_si-0_fr-0_tb-1_t-_ftc-_ftb-_mc-_mfc-_complete%20(6)-png.png)
5. There are different options for setting date parameters. You can use the predefined dates or set a specific date range. When you have completed your settings, click ok to save the date range.
-png.png?width=670&height=503&name=5_800x600_z-undefined_mz-0-5_mi-1_ti-0_ar-1_cr-0_si-0_fr-0_tb-1_t-_ftc-_ftb-_mc-_mfc-_complete%20(6)-png.png)
6. To sort by column heading, drag the column heading you want to sort by,
-png.png?width=670&height=503&name=6_800x600_z-undefined_mz-0-5_mi-1_ti-0_ar-1_cr-0_si-0_fr-0_tb-1_t-_ftc-_ftb-_mc-_mfc-_complete%20(6)-png.png)
6b. Drop into the menu bar.
-png.png?width=670&height=503&name=6b_800x600_z-undefined_mz-0-5_mi-1_ti-0_ar-1_cr-0_si-0_fr-0_tb-1_t-_ftc-_ftb-_mc-_mfc-_complete%20(1)-png.png)
-png.png?width=670&height=503&name=7_800x600_z-undefined_mz-0-5_mi-1_ti-0_ar-1_cr-0_si-0_fr-0_tb-1_t-_ftc-_ftb-_mc-_mfc-_complete%20(6)-png.png)
8. Your data grid is now sorted by work type.
-png.png?width=670&height=503&name=8_800x600_z-undefined_mz-0-5_mi-1_ti-0_ar-1_cr-0_si-0_fr-0_tb-1_t-_ftc-_ftb-_mc-_mfc-_complete%20(6)-png.png)
9. You can continue to filter your data grid by dragging additional column headings into the menu bar.
-png.png?width=670&height=503&name=9_800x600_z-undefined_mz-0-5_mi-1_ti-0_ar-1_cr-0_si-0_fr-0_tb-1_t-_ftc-_ftb-_mc-_mfc-_complete%20(6)-png.png)
9b. Drop
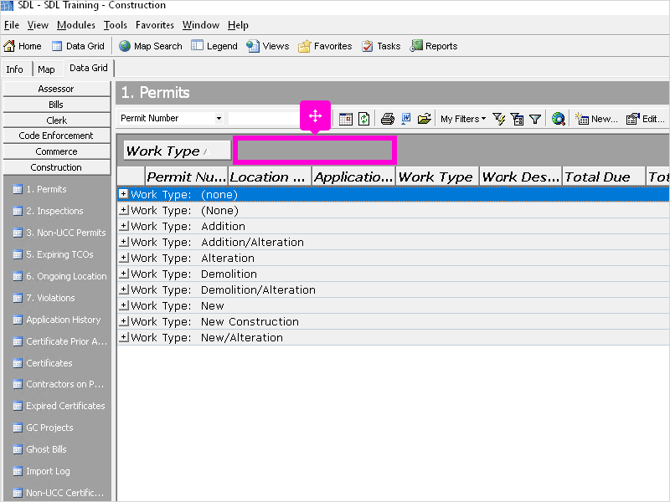
10. Use the Plus button to expand the results.
-png.png?width=670&height=503&name=10_800x600_z-undefined_mz-0-5_mi-1_ti-0_ar-1_cr-0_si-0_fr-0_tb-1_t-_ftc-_ftb-_mc-_mfc-_complete%20(6)-png.png)
11. We now have the data grid sorted first by work type and then by location address. We can continue to sort our data grid by dragging more column headings to the menu bar.
-png.png?width=670&height=503&name=11_800x600_z-undefined_mz-0-5_mi-1_ti-0_ar-1_cr-0_si-0_fr-0_tb-1_t-_ftc-_ftb-_mc-_mfc-_complete%20(6)-png.png)
12. Next drag the Total Balance field and drop into the menu bar.
-png.png?width=670&height=503&name=12_800x600_z-undefined_mz-0-5_mi-1_ti-0_ar-1_cr-0_si-0_fr-0_tb-1_t-_ftc-_ftb-_mc-_mfc-_complete%20(6)-png.png)
12b. Drop
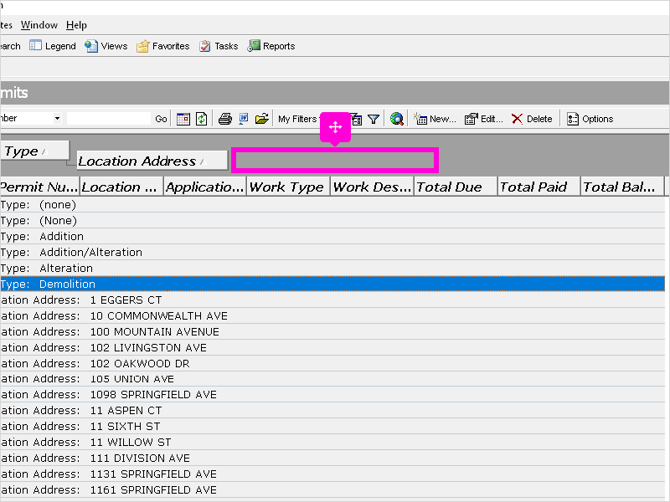
13. We have sorted our permits data grid by Work type, Location and then Total Balance.
-png.png?width=670&height=503&name=13_800x600_z-undefined_mz-0-5_mi-1_ti-0_ar-1_cr-0_si-0_fr-0_tb-1_t-_ftc-_ftb-_mc-_mfc-_complete%20(6)-png.png)
14. If you want to save your sorting parameters you can create a filter. The filter options are located in the menu bar. Each module has their own filters.
-png.png?width=670&height=503&name=14_800x600_z-undefined_mz-0-5_mi-1_ti-0_ar-1_cr-0_si-0_fr-0_tb-1_t-_ftc-_ftb-_mc-_mfc-_complete%20(6)-png.png)
15. By creating a filter you are limiting the records that will be viewed in the data grid. The records that do not match the filter criteria are still in the system just hidden from view.
-png.png?width=670&height=503&name=15_800x600_z-undefined_mz-0-5_mi-1_ti-0_ar-1_cr-0_si-0_fr-0_tb-1_t-_ftc-_ftb-_mc-_mfc-_complete%20(5)-png.png)
16. The my filter button will give you access to add and manage filters.
-png.png?width=670&height=503&name=16_800x600_z-undefined_mz-0-5_mi-1_ti-0_ar-1_cr-0_si-0_fr-0_tb-1_t-_ftc-_ftb-_mc-_mfc-_complete%20(4)-png.png)
17. The other filter options are preset to allow you to Filter by Selection.
-png.png?width=670&height=503&name=17_800x600_z-undefined_mz-0-5_mi-1_ti-0_ar-1_cr-0_si-0_fr-0_tb-1_t-_ftc-_ftb-_mc-_mfc-_complete%20(4)-png.png)
18. or to Filter by form.
-png.png?width=670&height=503&name=18_800x600_z-undefined_mz-0-5_mi-1_ti-0_ar-1_cr-0_si-0_fr-0_tb-1_t-_ftc-_ftb-_mc-_mfc-_complete%20(4)-png.png)
19. You can also Turn the Grid filter on and off.
-png.png?width=670&height=503&name=19_800x600_z-undefined_mz-0-5_mi-1_ti-0_ar-1_cr-0_si-0_fr-0_tb-1_t-_ftc-_ftb-_mc-_mfc-_complete%20(3)-png.png)
20. Go Back to the 'My filter' button and click on 'Add New Filter" .
-png.png?width=670&height=503&name=20_800x600_z-undefined_mz-0-5_mi-1_ti-0_ar-1_cr-0_si-0_fr-0_tb-1_t-_ftc-_ftb-_mc-_mfc-_complete%20(3)-png.png)
21. Type in a name for the Filter and Check the box if you want to share this filter with other employees.
-png.png?width=670&height=503&name=21_800x600_z-undefined_mz-0-5_mi-1_ti-0_ar-1_cr-0_si-0_fr-0_tb-1_t-_ftc-_ftb-_mc-_mfc-_complete%20(3)-png.png)
21b. Click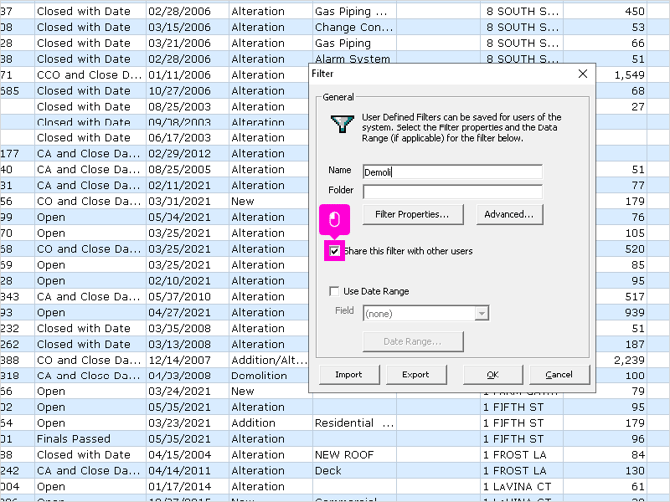
22. You can narrow down your filter results by setting a date parameter. If you have already set a date range using the calendar in the menu bar, you can leave this blank.-png.png?width=670&height=503&name=22_800x600_z-undefined_mz-0-5_mi-1_ti-0_ar-1_cr-0_si-0_fr-0_tb-1_t-_ftc-_ftb-_mc-_mfc-_complete%20(3)-png.png)
23. If you want to view a different date parameter, Set the conditions by following the process we mentioned earlier.-png.png?width=670&height=503&name=23_800x600_z-undefined_mz-0-5_mi-1_ti-0_ar-1_cr-0_si-0_fr-0_tb-1_t-_ftc-_ftb-_mc-_mfc-_complete%20(3)-png.png)
24. Click on filter properties to access the filter settings.-png.png?width=670&height=503&name=24_800x600_z-undefined_mz-0-5_mi-1_ti-0_ar-1_cr-0_si-0_fr-0_tb-1_t-_ftc-_ftb-_mc-_mfc-_complete%20(3)-png.png)
25. First step is to decide which field you want to filter your data grid by and select it from the drop down list.-png.png?width=670&height=503&name=25_800x600_z-undefined_mz-0-5_mi-1_ti-0_ar-1_cr-0_si-0_fr-0_tb-1_t-_ftc-_ftb-_mc-_mfc-_complete%20(3)-png.png)
26. We chose work type for our example.-png-1.png?width=670&height=503&name=26_800x600_z-undefined_mz-0-5_mi-1_ti-0_ar-1_cr-0_si-0_fr-0_tb-1_t-_ftc-_ftb-_mc-_mfc-_complete%20(2)-png-1.png)
27. The comparison operators are used to search data and display records that match the criteria.-png-1.png?width=670&height=503&name=27_800x600_z-undefined_mz-0-5_mi-1_ti-0_ar-1_cr-0_si-0_fr-0_tb-1_t-_ftc-_ftb-_mc-_mfc-_complete%20(2)-png-1.png)
28. We want to return all records that have a work type that is equal to demolition.
We will use the 'equal to' sign.-png.png?width=670&height=503&name=28_800x600_z-undefined_mz-0-5_mi-1_ti-0_ar-1_cr-0_si-0_fr-0_tb-1_t-_ftc-_ftb-_mc-_mfc-_complete%20(2)-png.png)
29. and then Type in Demolition.-png.png?width=670&height=503&name=29_800x600_z-undefined_mz-0-5_mi-1_ti-0_ar-1_cr-0_si-0_fr-0_tb-1_t-_ftc-_ftb-_mc-_mfc-_complete%20(2)-png.png)
30. If you are not sure of the field name, you can use a different comparison operator. The 'like' option will return records that are similar or like, the parameter you enter. It will not have to be an exact match.-png.png?width=670&height=503&name=30_800x600_z-undefined_mz-0-5_mi-1_ti-0_ar-1_cr-0_si-0_fr-0_tb-1_t-_ftc-_ftb-_mc-_mfc-_complete%20(2)-png.png)
31. Using the 'like' function is a broader search so you will get more records returned than by using the equal to function. We can type in 'Demo' if we want to return a broader range of records.-png.png?width=670&height=503&name=31_800x600_z-undefined_mz-0-5_mi-1_ti-0_ar-1_cr-0_si-0_fr-0_tb-1_t-_ftc-_ftb-_mc-_mfc-_complete%20(2)-png.png)
32. Once you set your parameter click OK to save.-png.png?width=670&height=503&name=32_800x600_z-undefined_mz-0-5_mi-1_ti-0_ar-1_cr-0_si-0_fr-0_tb-1_t-_ftc-_ftb-_mc-_mfc-_complete%20(2)-png.png)
33. You're filter will be added to the list of existing filters for the module.-png.png?width=670&height=503&name=33_800x600_z-undefined_mz-0-5_mi-1_ti-0_ar-1_cr-0_si-0_fr-0_tb-1_t-_ftc-_ftb-_mc-_mfc-_complete%20(2)-png.png)
34. If you have a large department you may have to scroll to the bottom to find your filter. Use the Manage filter button to delete old filters that are no longer needed.-png.png?width=670&height=503&name=34_800x600_z-undefined_mz-0-5_mi-1_ti-0_ar-1_cr-0_si-0_fr-0_tb-1_t-_ftc-_ftb-_mc-_mfc-_complete%20(2)-png.png)
35. You can see our data grid now displays a list of permits with the work type of 'Demolition'.-png.png?width=670&height=503&name=35_800x600_z-undefined_mz-0-5_mi-1_ti-0_ar-1_cr-0_si-0_fr-0_tb-1_t-_ftc-_ftb-_mc-_mfc-_complete%20(2)-png.png)
36. If you are not getting the return you need or there are too many records you can add criteria to the filter which will narrow down your results. Click Manage Filters to edit your filter.-png.png?width=670&height=503&name=36_800x600_z-undefined_mz-0-5_mi-1_ti-0_ar-1_cr-0_si-0_fr-0_tb-1_t-_ftc-_ftb-_mc-_mfc-_complete%20(2)-png.png)
37. Highlight your filter and click edit.-png.png?width=670&height=503&name=37_800x600_z-undefined_mz-0-5_mi-1_ti-0_ar-1_cr-0_si-0_fr-0_tb-1_t-_ftc-_ftb-_mc-_mfc-_complete%20(2)-png.png)
38. In order to further narrow down our results, we need to add an additional search parameter. We use the next section labeled "then by".-png.png?width=670&height=503&name=38_800x600_z-undefined_mz-0-5_mi-1_ti-0_ar-1_cr-0_si-0_fr-0_tb-1_t-_ftc-_ftb-_mc-_mfc-_complete%20(2)-png.png)
39. In our example, We are filtering by work type equal to demolition and we want to also find records that have a total due. Select Total Due from the drop down.-png.png?width=670&height=503&name=39_800x600_z-undefined_mz-0-5_mi-1_ti-0_ar-1_cr-0_si-0_fr-0_tb-1_t-_ftc-_ftb-_mc-_mfc-_complete%20(2)-png.png)
40. We want to display any permit with any amount due. We select the 'Greater Than " function.-png.png?width=670&height=503&name=40_800x600_z-undefined_mz-0-5_mi-1_ti-0_ar-1_cr-0_si-0_fr-0_tb-1_t-_ftc-_ftb-_mc-_mfc-_complete%20(2)-png.png)
41. And enter 0. This should return all records with an amount greater than 0 in the amount due field.-png.png?width=670&height=503&name=41_800x600_z-undefined_mz-0-5_mi-1_ti-0_ar-1_cr-0_si-0_fr-0_tb-1_t-_ftc-_ftb-_mc-_mfc-_complete%20(2)-png.png)
42. Our final filter setting is
work type = demolition,
then by Total Due > 0 .
You can add more limits if desired. The more parameters you add the less results will display in the grid.-png.png?width=670&height=503&name=42_800x600_z-undefined_mz-0-5_mi-1_ti-0_ar-1_cr-0_si-0_fr-0_tb-1_t-_ftc-_ftb-_mc-_mfc-_complete%20(2)-png.png)
43. Remember the records will have to match both criteria to display in the results.
Click ok when you have finished adding parameters.-png.png?width=670&height=503&name=43_800x600_z-undefined_mz-0-5_mi-1_ti-0_ar-1_cr-0_si-0_fr-0_tb-1_t-_ftc-_ftb-_mc-_mfc-_complete%20(1)-png.png)
44. You can see our results are now displaying only records with a Work type of demolition and those records that also have a Total Due greater than 0.-png.png?width=670&height=503&name=44_800x600_z-undefined_mz-0-5_mi-1_ti-0_ar-1_cr-0_si-0_fr-0_tb-1_t-_ftc-_ftb-_mc-_mfc-_complete%20(1)-png.png)
45. If you find you are not getting the results you expect try turning the grid filter off and on and then reloading your filter. If you need additional assistance please contact our Support Team.-png.png?width=670&height=503&name=45_800x600_z-undefined_mz-0-5_mi-1_ti-0_ar-1_cr-0_si-0_fr-0_tb-1_t-_ftc-_ftb-_mc-_mfc-_complete%20(1)-png.png)
Grouping Records in a Data Grid (Group By)
A feature within SDL data grids that lets users organize and view records by column, layered on top of standard filtering.
What this is and why to recommend it
Every SDL data grid is a table of columns and rows. Beyond sorting or filtering rows out of view, users can group rows by the value in one or more columns, so the grid visually clusters records together (e.g. all permits of the same work type collapsed under one expandable heading) instead of listing them as a flat list.
This is useful any time a user wants to visually organize or scan a data grid rather than just narrow it down — common cases include:
- Preparing information for an OPRA (Open Public Records Act, New Jersey) request, where records need to be organized by type/category for review
- Getting a quick visual count or overview of how many records fall into each category (work type, status, inspector, municipality, etc.)
- Making a large, busy data grid easier to scan and navigate
- Any time a user wants to see records "grouped by" or "organized by" a specific field, rather than simply filtered down to it
How to use it
- In any data grid, right-click in the toolbar (near the Options button).
- Select Group By Box to turn it on. This adds a gray drop area below the toolbar.
- Drag the header of the column to group by (e.g. Work Type) down into that gray area. The grid will reorganize into collapsible groups based on that column's values.
- Click a group to expand or collapse it and see the records inside.
Grouping by multiple columns
More than one column can be dragged into the gray area at once. Each additional column adds a nested sub-grouping level within the first (e.g. group by Work Type, then by Status within each work type). Columns can be dragged in any order, and removing a column from the gray area (drag it back up, or drag it off) ungroups by that field.