To run reports on the data, you can either use a preformatted report or filter the data you want and then export it.
Preformatted Reports - FORMS
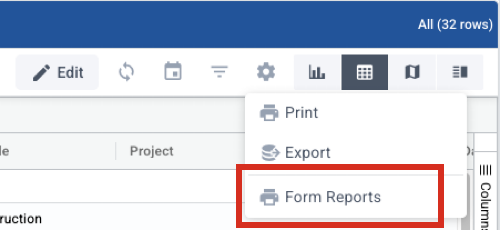
To run a preformatted report, from the data grid, select settings wheel in the top right menu:

Then choose Form Reports from the options:
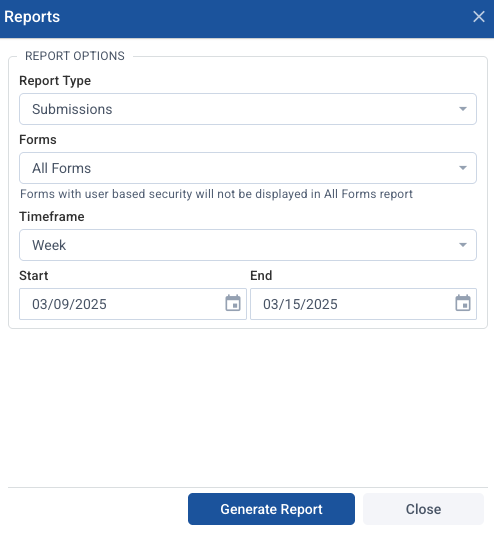
The next window will give you options for the report. For report type, you can choose Submissions, Payments, Appointments or Summary Information. Forms will let you narrow the results to a specific form, or leave it at all forms. You can narrow the date by timeframe - quick options for a week, a month, etc. - or use a custom time period by entering the start and end dates. Choosing Generate Report will give you a formatted report that is ready to print or to save by printing to PDF.
Preformatted Reports - FORMS and PERMITS
Choose Reports from the leftside menu:
Under "Select a Report," choose the type of report you want. Then choose the options you want. If you select a timeframe, such as last year, that will autofill the dates selected.
- Note: You MUST choose a department. You can then leave it at "all forms" (all forms in that department) or choose a specific form.

Reports from Data Grid
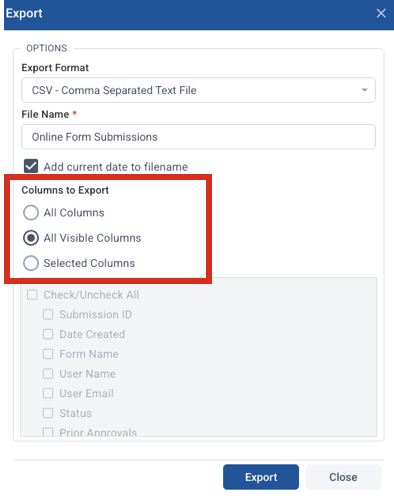
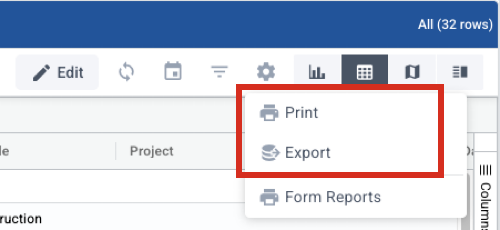
To create a custom report from the data grid, filter or sort the data as needed (see Working with the Data Grid in Connect). Once you have the data showing what you want on the report, under the settings wheel choose either print or export. Print will create a formatted report ready to print or save by printing to PDF. Export will create a document in CSV, Excel, or GeoJSON format.
For both the Print and Export options, you can choose to show all columns, only the ones you have visible, or make selections in this window: